On 26th July 2005, over 1,000 lives were lost to drowning, electrocution, and landslides across Mumbai.
More than 14,000 homes were destroyed. 200,000 tonnes of the city's belongings washed away, soaked, lost forever.
The flood lasted hours. The recovery took years.
Twenty years later, Mumbai still has no system to ensure it recovers any faster.
How many more monsoons before we design one?
The Proposed Solution
Apda Mitra is a digital ecosystem designed to bridge the "garbage-in, garbage-out" gap in disaster data collection. It links ground-level evidence directly to fiscal approval workflows, ensuring transparent and rapid fund disbursement.
Overview
Apda Mitra is a crisis informatics platform for verifiable data collection and defensible fund estimation and allocation in post-disaster needs assessments.
PDNA workflows today rely heavily on unstructured data — KoBoCollect, Google Forms, Excel, and consultants' subjective judgments. At scale, this creates significant challenges:
- Fragmented and inconsistent information
- High manual effort in validation
- Errors that directly impact assessment outcomes
- Delayed fund release to critical lifeline institutions
- Verifiable Ground Truth Hospital staff directly capture geospatial damage data, bypassing traditional paper-based delays.
Once evidence is captured at the facility level, the data routes directly to the Zonal engineers for statutory verification, locking coordinates and preventing manual editing.
- Ward Verification Ward Engineers verify ground-level damage claims and fund requests.
- Grade 3 Escalation Severe damage reports automatically escalate to Zonal Officers.
Defensible Fund Allocation
To eliminate the manual errors and subjectivity of traditional post-disaster needs assessments, Apda Mitra features an integrated auto-costing engine. By mapping verified damage severity directly to standardized fiscal ranges, the platform provides city officials with real-time, audit-ready budget estimations.
What even is a disaster?

The scale of that disaster depends on:
- Vulnerability
- Capacity
This gives us the final equation for Risk. This entire thesis is built on one fact: We can't stop the Hazard—we can't stop the rain. This project is a service design to find and fix the Vulnerability.

Disaster risk reduction

Disaster risk reduction is aimed at preventing new and reducing existing disaster risk and managing residual risk, all of which contribute to strengthening resilience and therefore to the achievement of sustainable development (UNDRR, 2017).
Sendai Framework for Disaster Risk Reduction (SFDRR) 2015-2030 re-calibrated the focus from Hazard to Risk (defined as Risk = Hazard x Vulnerability)
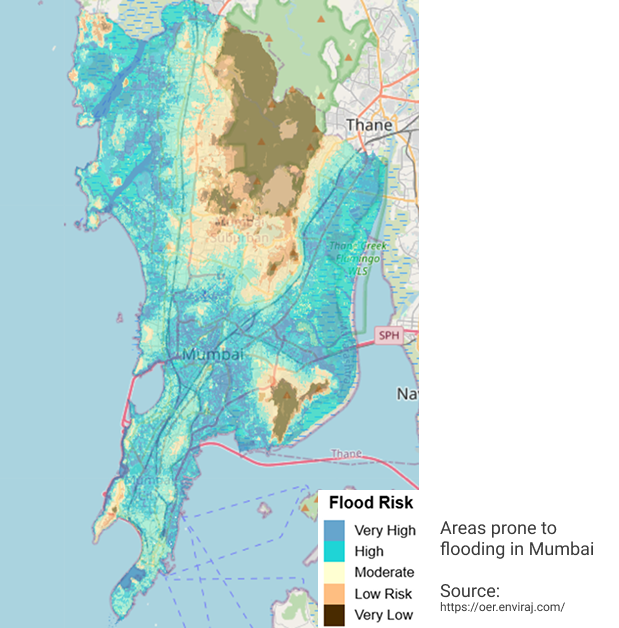
Mumbai and its vulnerabilities
Mumbai, a coastal area of 387.32 km² with over 9.3 million people, is highly vulnerable due to its geography and high population density.
The district is prone to multiple hazards like earthquakes, cyclones, and landslides. But floods are a definite annual recurring, wicked problem because they are multi-modal—caused by a mix of its vulnerabilities:
- Infrastructure: Inadequate drainage networks.
- Geography: Low-lying regions and river overflow.
- Economic: High mixed land use.
- Climatic: Heavy rainfalls and cloudbursts.
All these are exacerbated by informal settlements, siltation, and resource gaps.
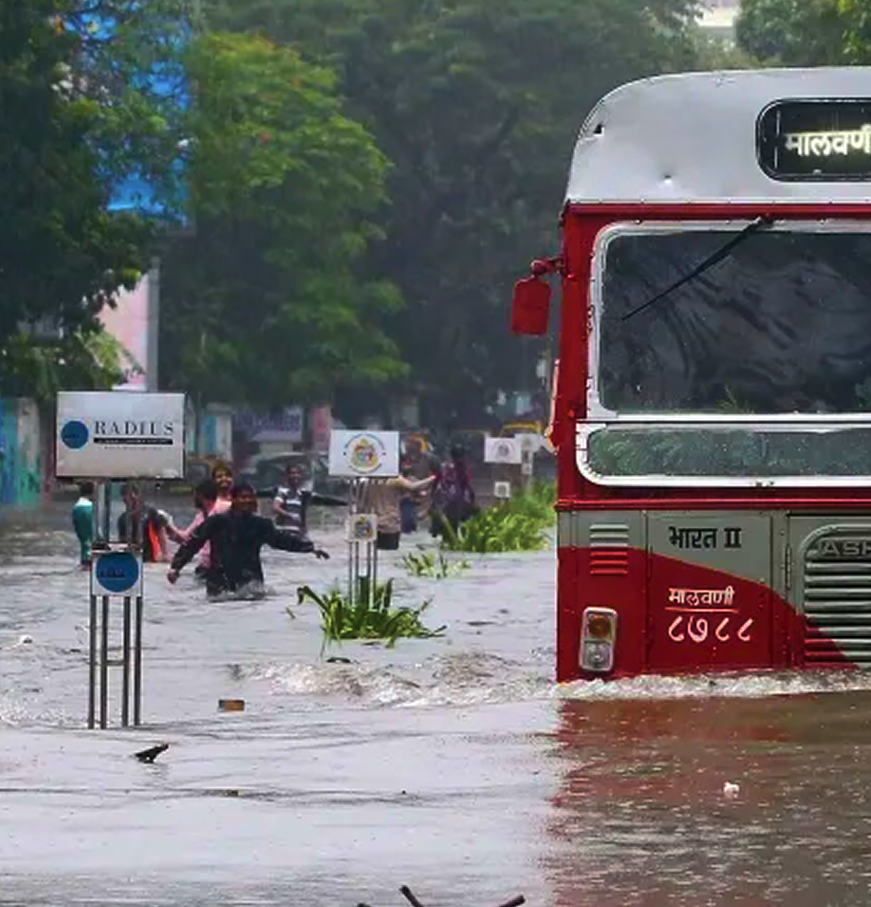
City and Disaster
The 26th of July 2005 is the benchmark disaster, defined by an unprecedented rainfall of 944.2 mm in the Suburban District, which led to the "complete disruption of normal life". This extreme event overwhelmed the city's drainage network, which is already compromised by geography, reclaimed land, and urbanization. The resulting floods caused widespread "havoc" and "huge economic losses," establishing the benchmark for Mumbai's critical flood risk.
Since the benchmark 2005 disaster, Mumbai has continued to face multiple "Flood like situations," including significant, recurring events in 2017 and 2019 that affected the entire Greater Mumbai area.
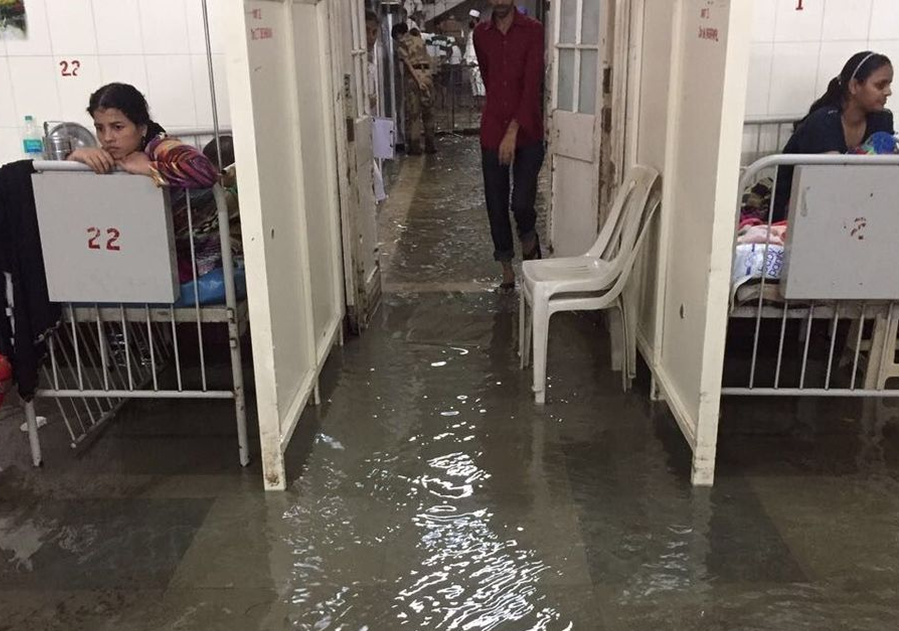
Healthcare choke point
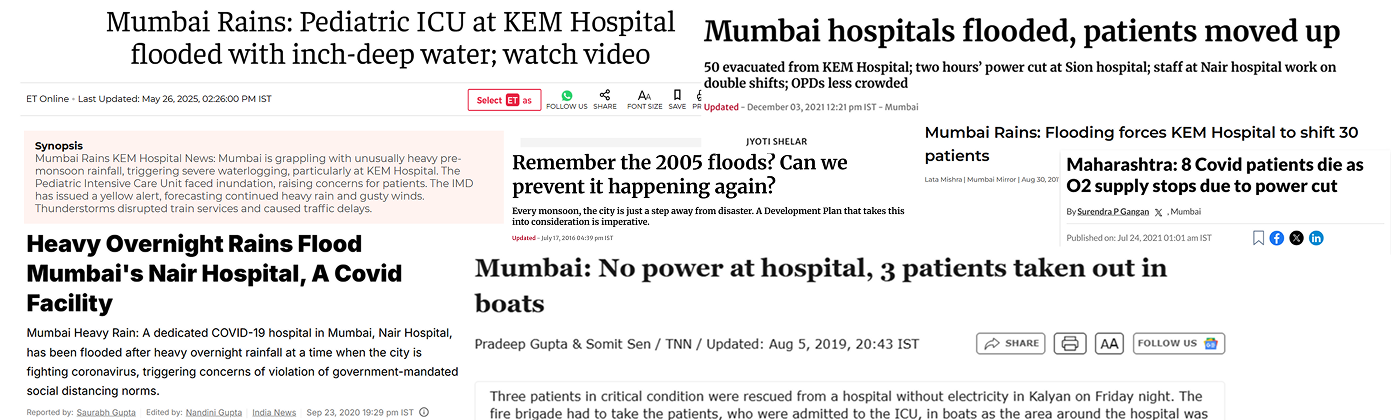
When the city of Mumbai floods, its critical infrastructure is paralyzed. In this recurring crisis, the most devastating failure is that of its public hospitals.
These facilities, the last line of defence for the populace, are often the first to be compromised—basements flood, power systems fail, and life-saving equipment is destroyed. This turns a manageable natural hazard into a full-scale urban catastrophe.
DDMA & Governance Void

The official DM Plan mandates a comprehensive mitigation strategy, combining Structural Measures (capital investment, flood proofing) with Non-Structural Measures, including a "Safety Audit of all critical lifeline structures".
This plan is governed by the DDMA (District Disaster Management Authority), with the BMC Administrator (the Addl. Commissioner) acting as the central authority for coordination and funding.
However, the execution of this plan reveals the critical flaw: the DDMA operates using Emergency Support Functions (ESFs)— specialized, siloed teams.
This creates a Governance Void:
- ESF 6 (Health) is siloed to handle patients, while
- ESF 13 (Public Works) is siloed to handle public roads.
This structure is not designed for the inter agency problem of hospital mitigation, leaving the Administrator with no clear data channel to make objective, defensible funding decisions.

While Mumbai's governance structure (DDMA, ESFs) and flood mitigation plans are well-defined, its extreme vulnerability (reclaimed land, 2005 flood) is amplified by a critical, acknowledged gap: systemic inter-agency siloes and a lack of objective tools, which has created an "administrator's nightmare" of subjective, indefensible budgeting.
The Research Process
- Document Analysis
- Literature Review
- Expert Interviews
- Service Failure Matrix
- JTBD
- Persona
- User Journeys
- Task Analysis
- Low-Fidelity Testing
- High-Fidelity Logic
- Engineer Feedback
- Pain Points (Main Insights)
- Key Decision
- Problem Statement
- How Might We
Expert Interview: PDNA Framework
To strengthen the ground reality of practices mentioned in the documents, expert interviews were conducted with a PDNA Consultant and two DEOC architects. The following were some key insights that were later themed.
Insights
DDMA Flood Recovery Ecosystem
Addl. Comm. (BMC)
6 — Health
13 — PWD
Asst. Comm.
EOC
MS
Engineer
SDMA
Ministry
/ State Audit
Consultant
Safety Audit
Inspection
Reporting
Memorandum
Sanction
Field Visit
Activation
Risk Scoring
Compilation
(ad hoc)
Meeting
Forms
Tool
Forms
Website
Portal
EOC App
DDMA / Addl. Comm. (BMC)
The Central Authority that oversees the city's flood mitigation, disaster response, and funds.
User persona
Developing deep empathy for users operating under high-intensity crisis scenarios.
Experience mapping
Service failure matrix
A systematic breakdown of service failures across the current manual workflow.
Problem statement
Mumbai city’s government hospitals experience annual flooding that impacts its functioning due to poor recovery due to poor, unverifiable and unstandardised data collection that leads to insensible recovery fund estimation and fair distribution based on ground reality.
How might we
How might we give the DDMA Administrator a single, transparent, and auditable source of truth for hospital flood risk — so that capital recovery investment decisions are objectively justifiable?
A Glass Box Defensible Data collection and fund estimation 2-front digital system for Mumbai's government hospitals — that eliminates the Garbage In / Garbage Out problem at source, and a command dashboard that replaces the expert's Black Box with a fully transparent, decomposable, audit-ready risk score — giving the Administrator the Defensible Confidence to justify recovery investment.
Task analysis
Breaking down the interaction models for both the Field Collection App and the Central Admin Dashboard.
Data collection and fund estimation framework
The two application service ecosysyem, Apda Mitra proposes viewing the situation as before and fater data collection, Apda Mitra Field and Apda Mitra Command
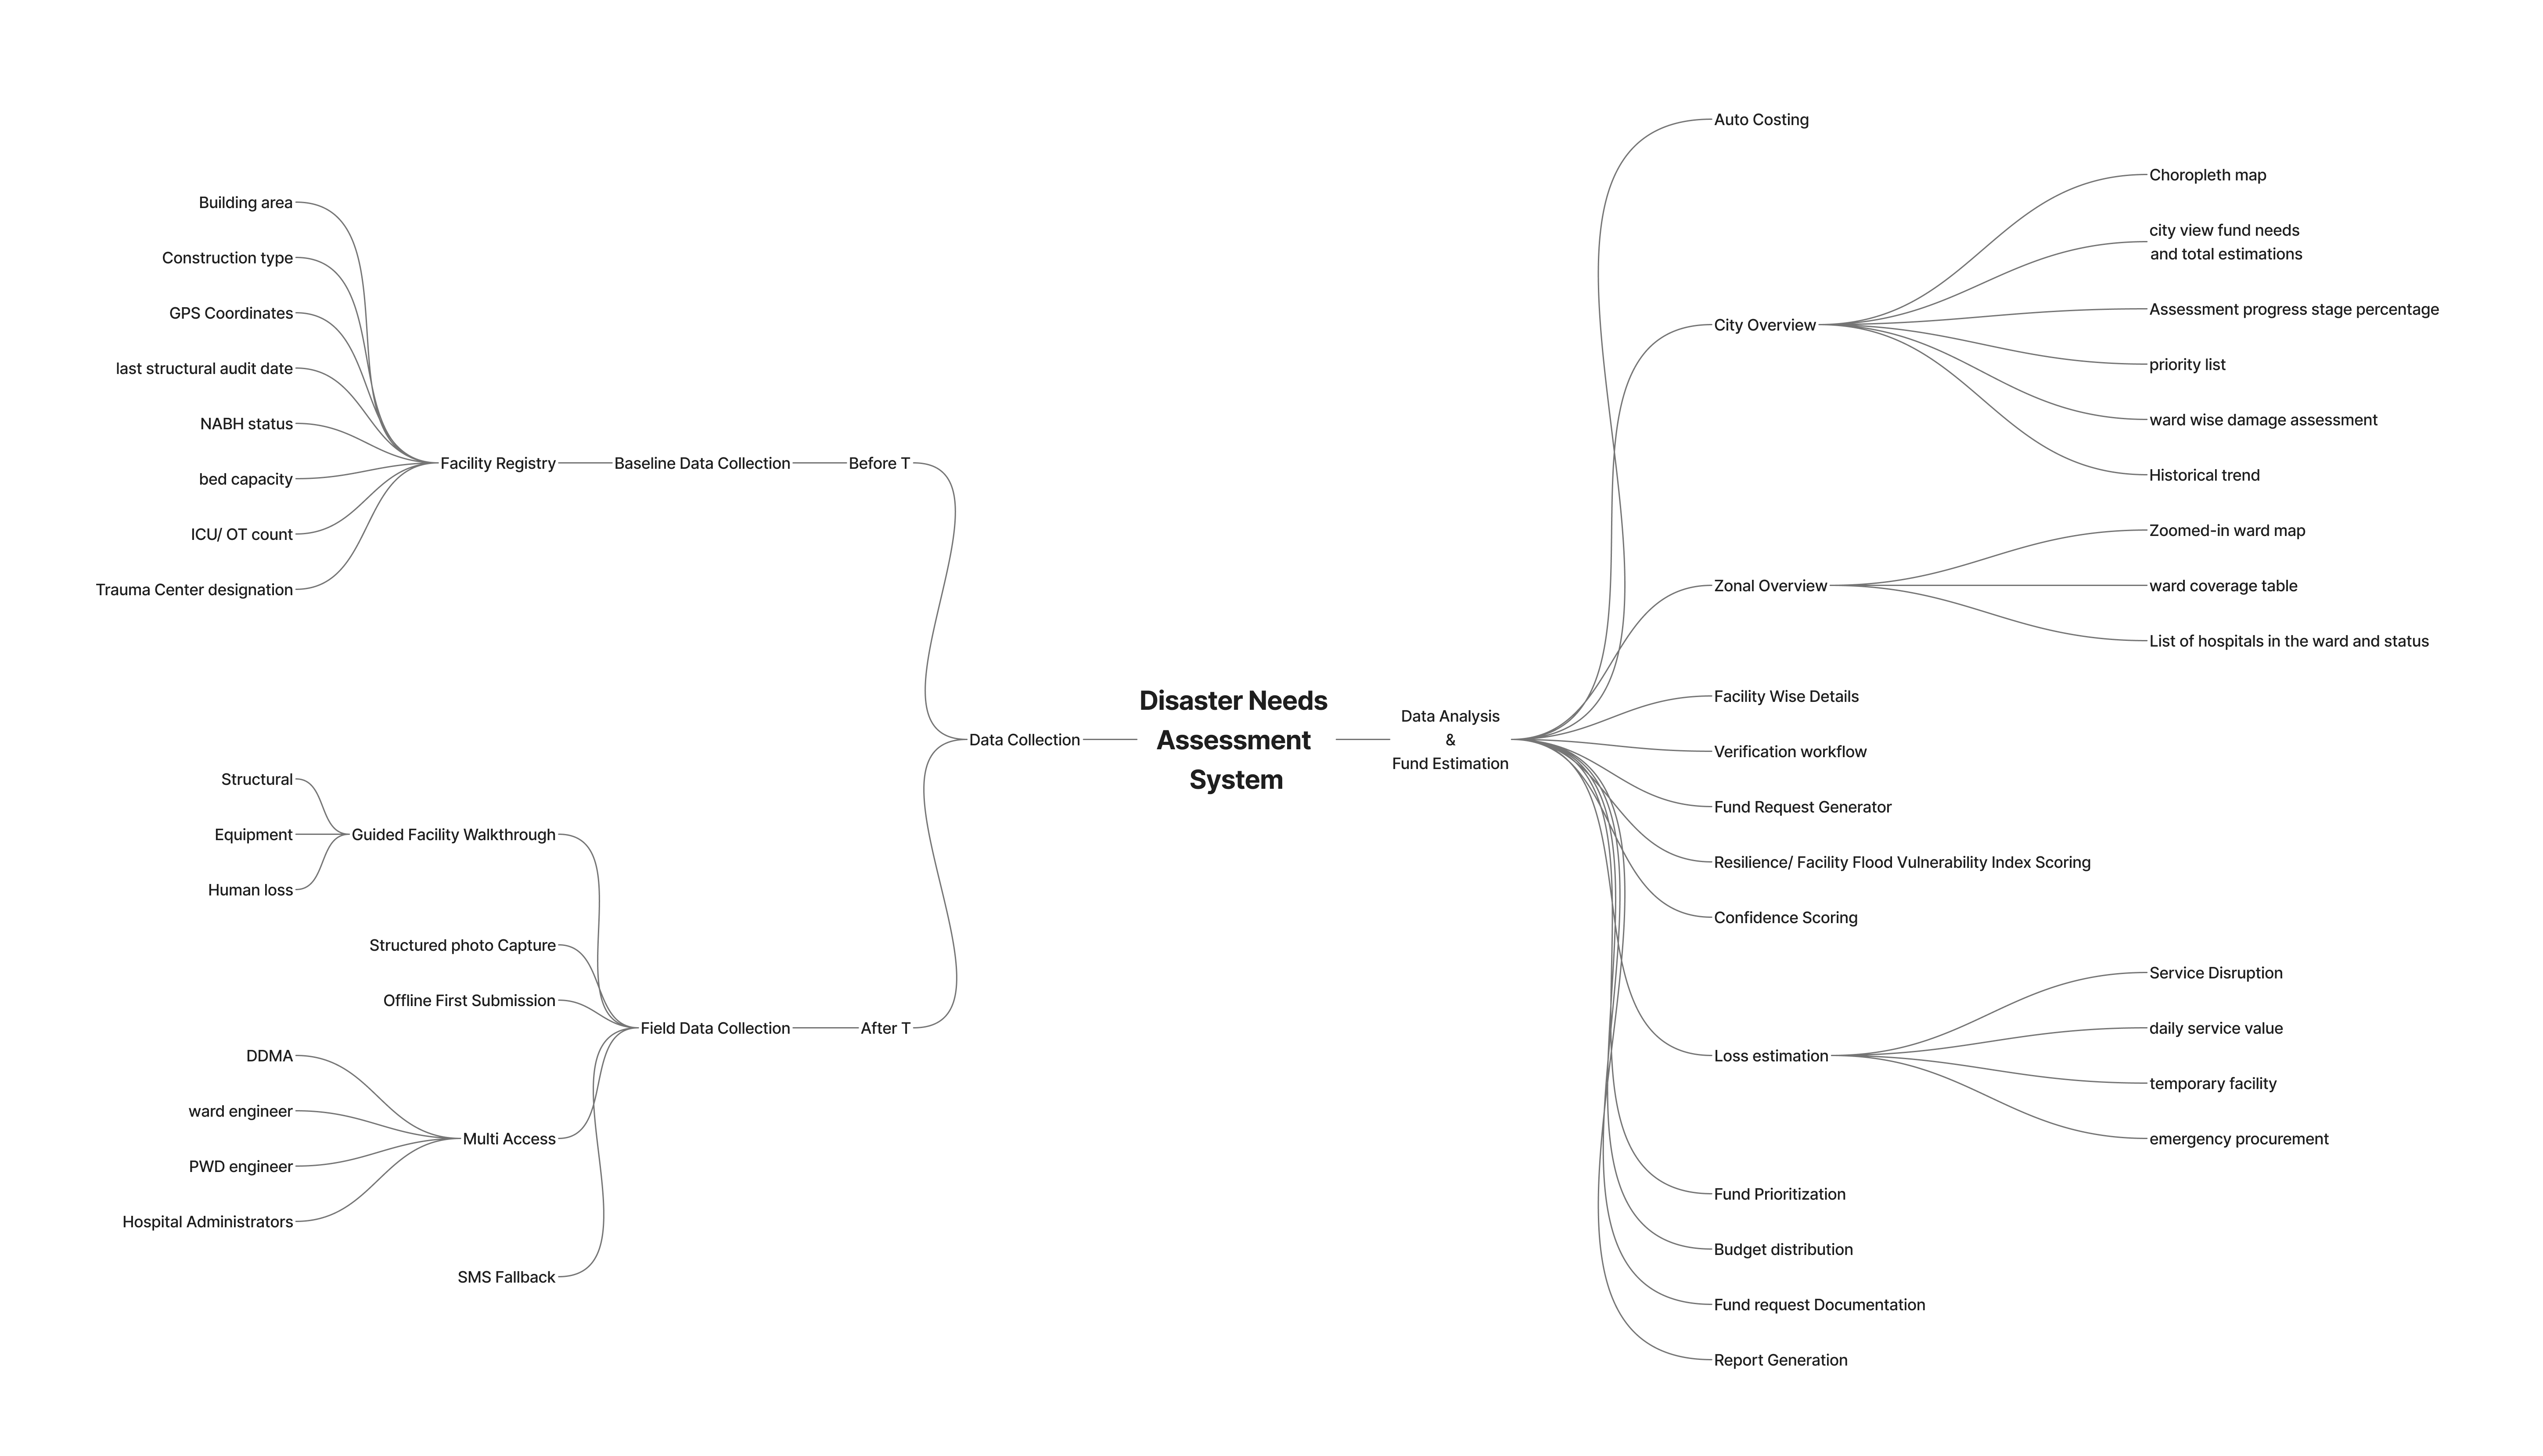
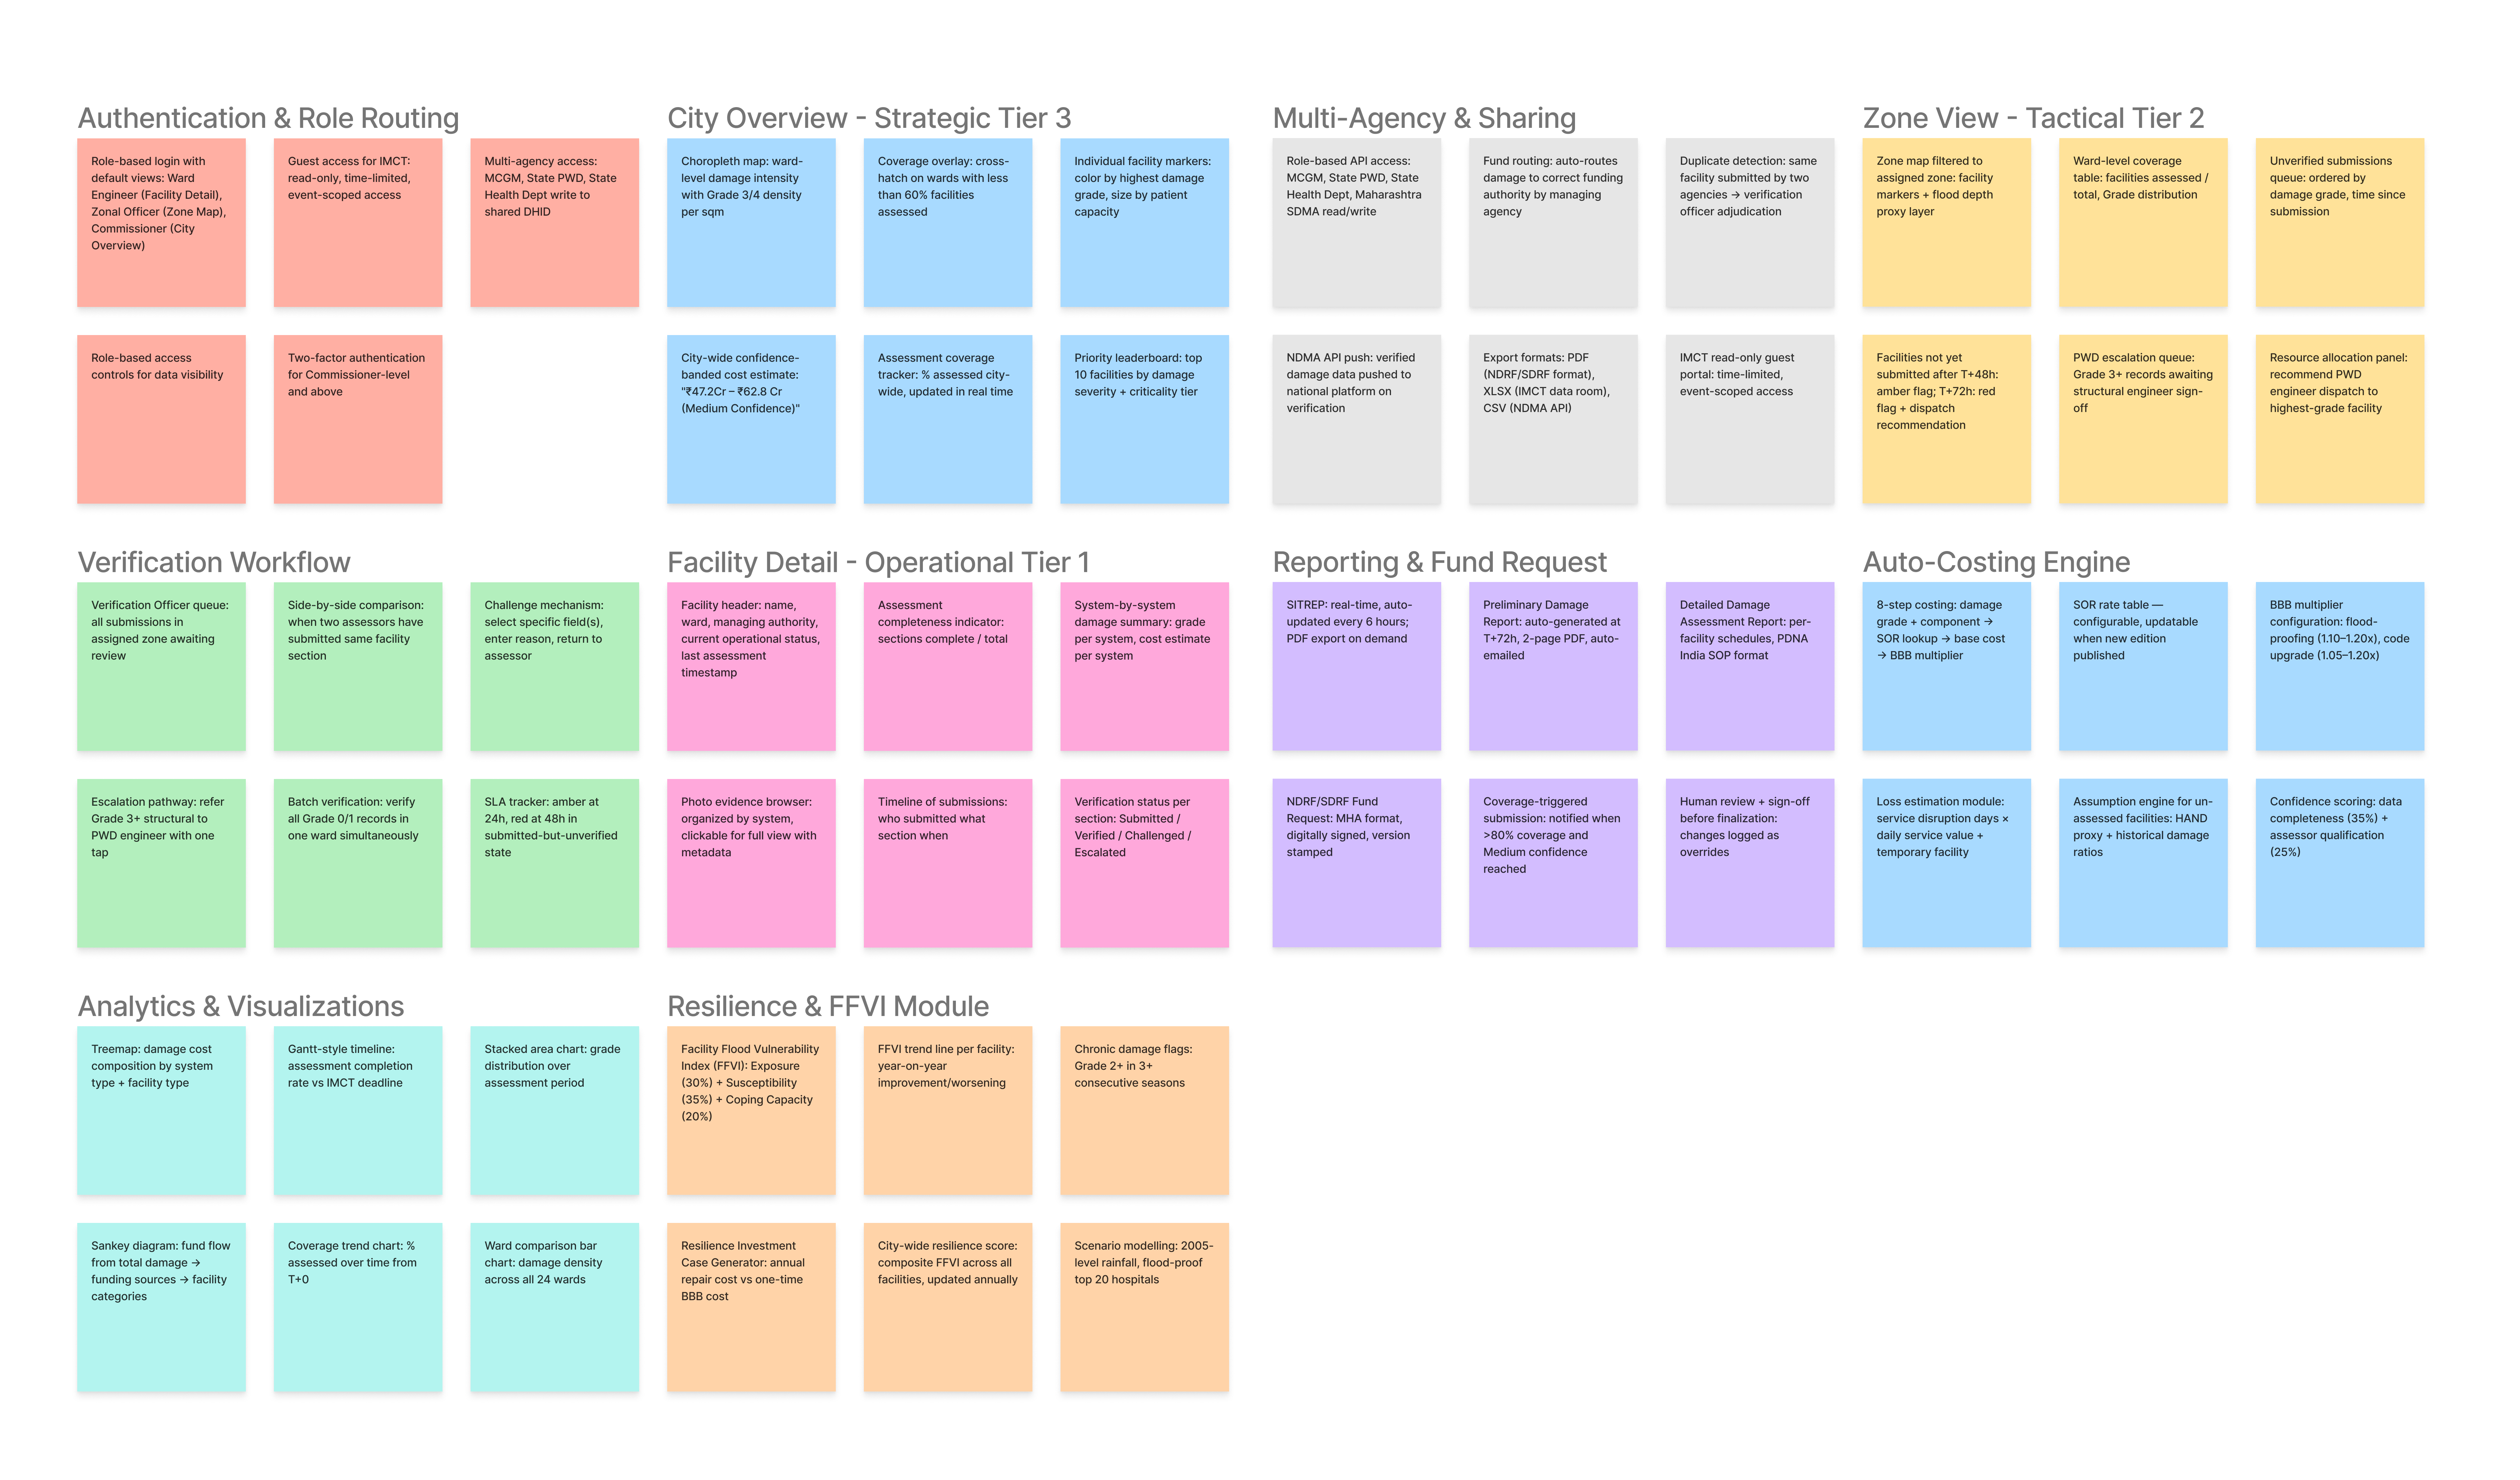
Feature requirement board
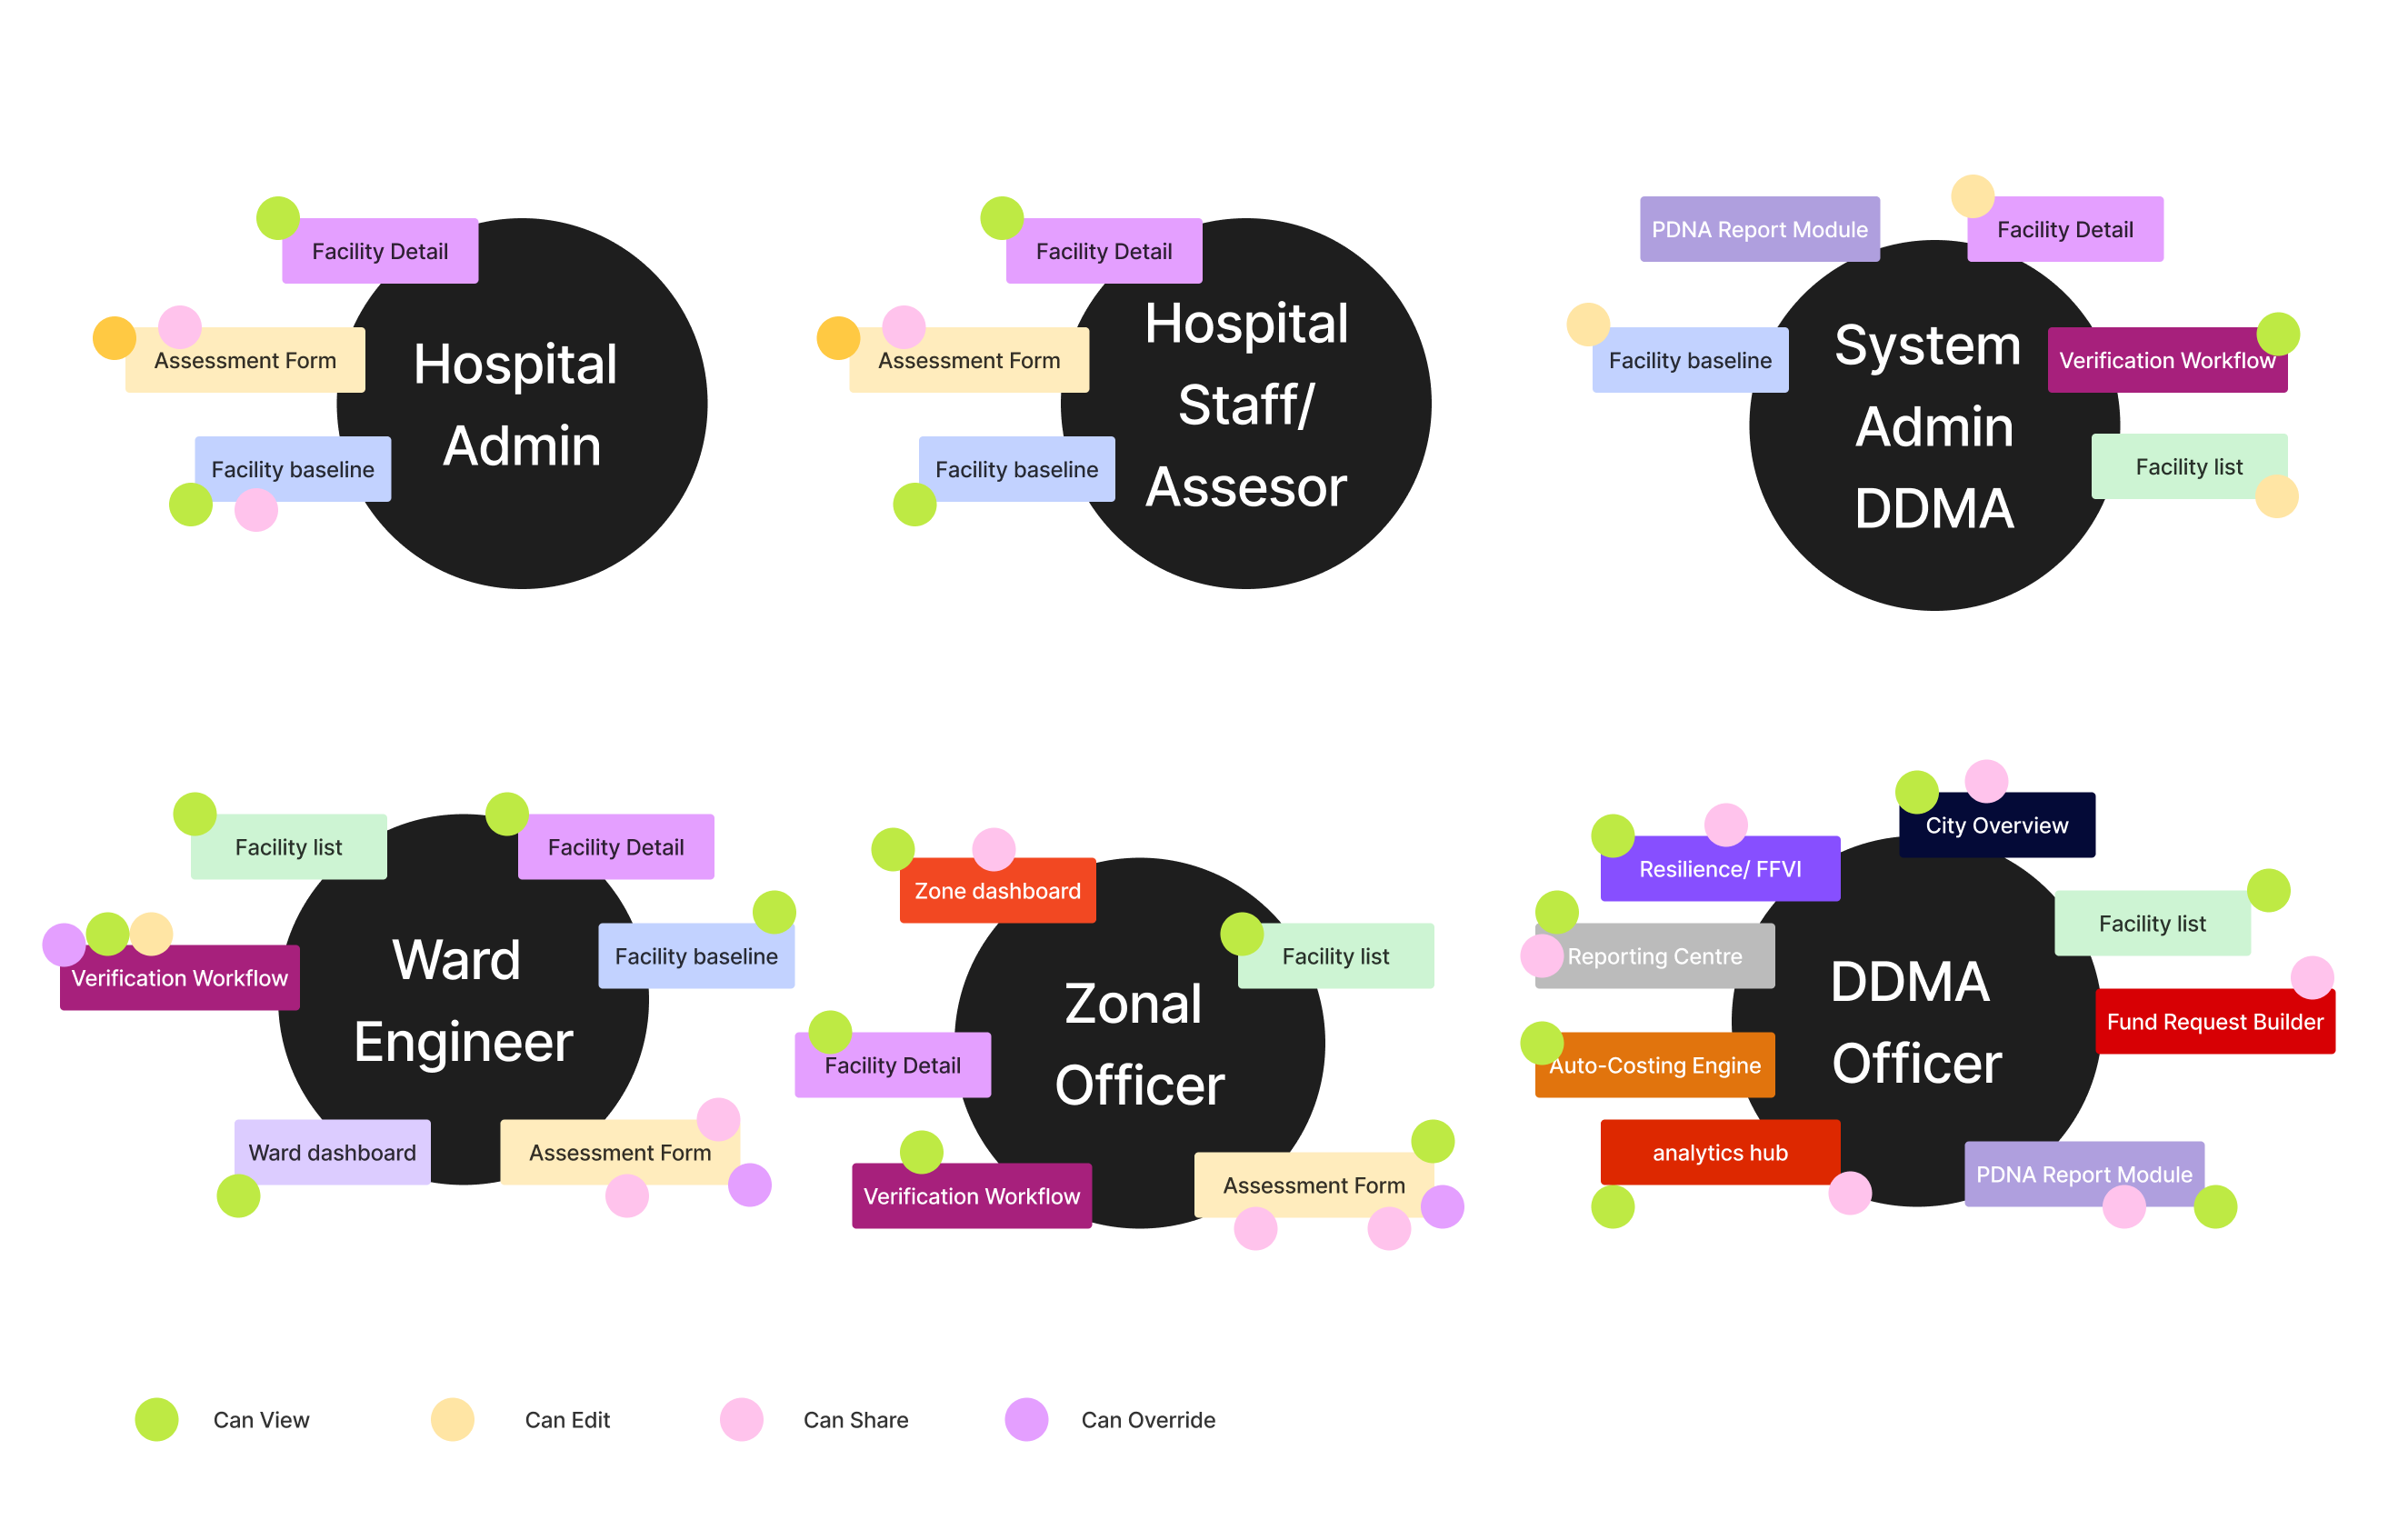
Role based access control
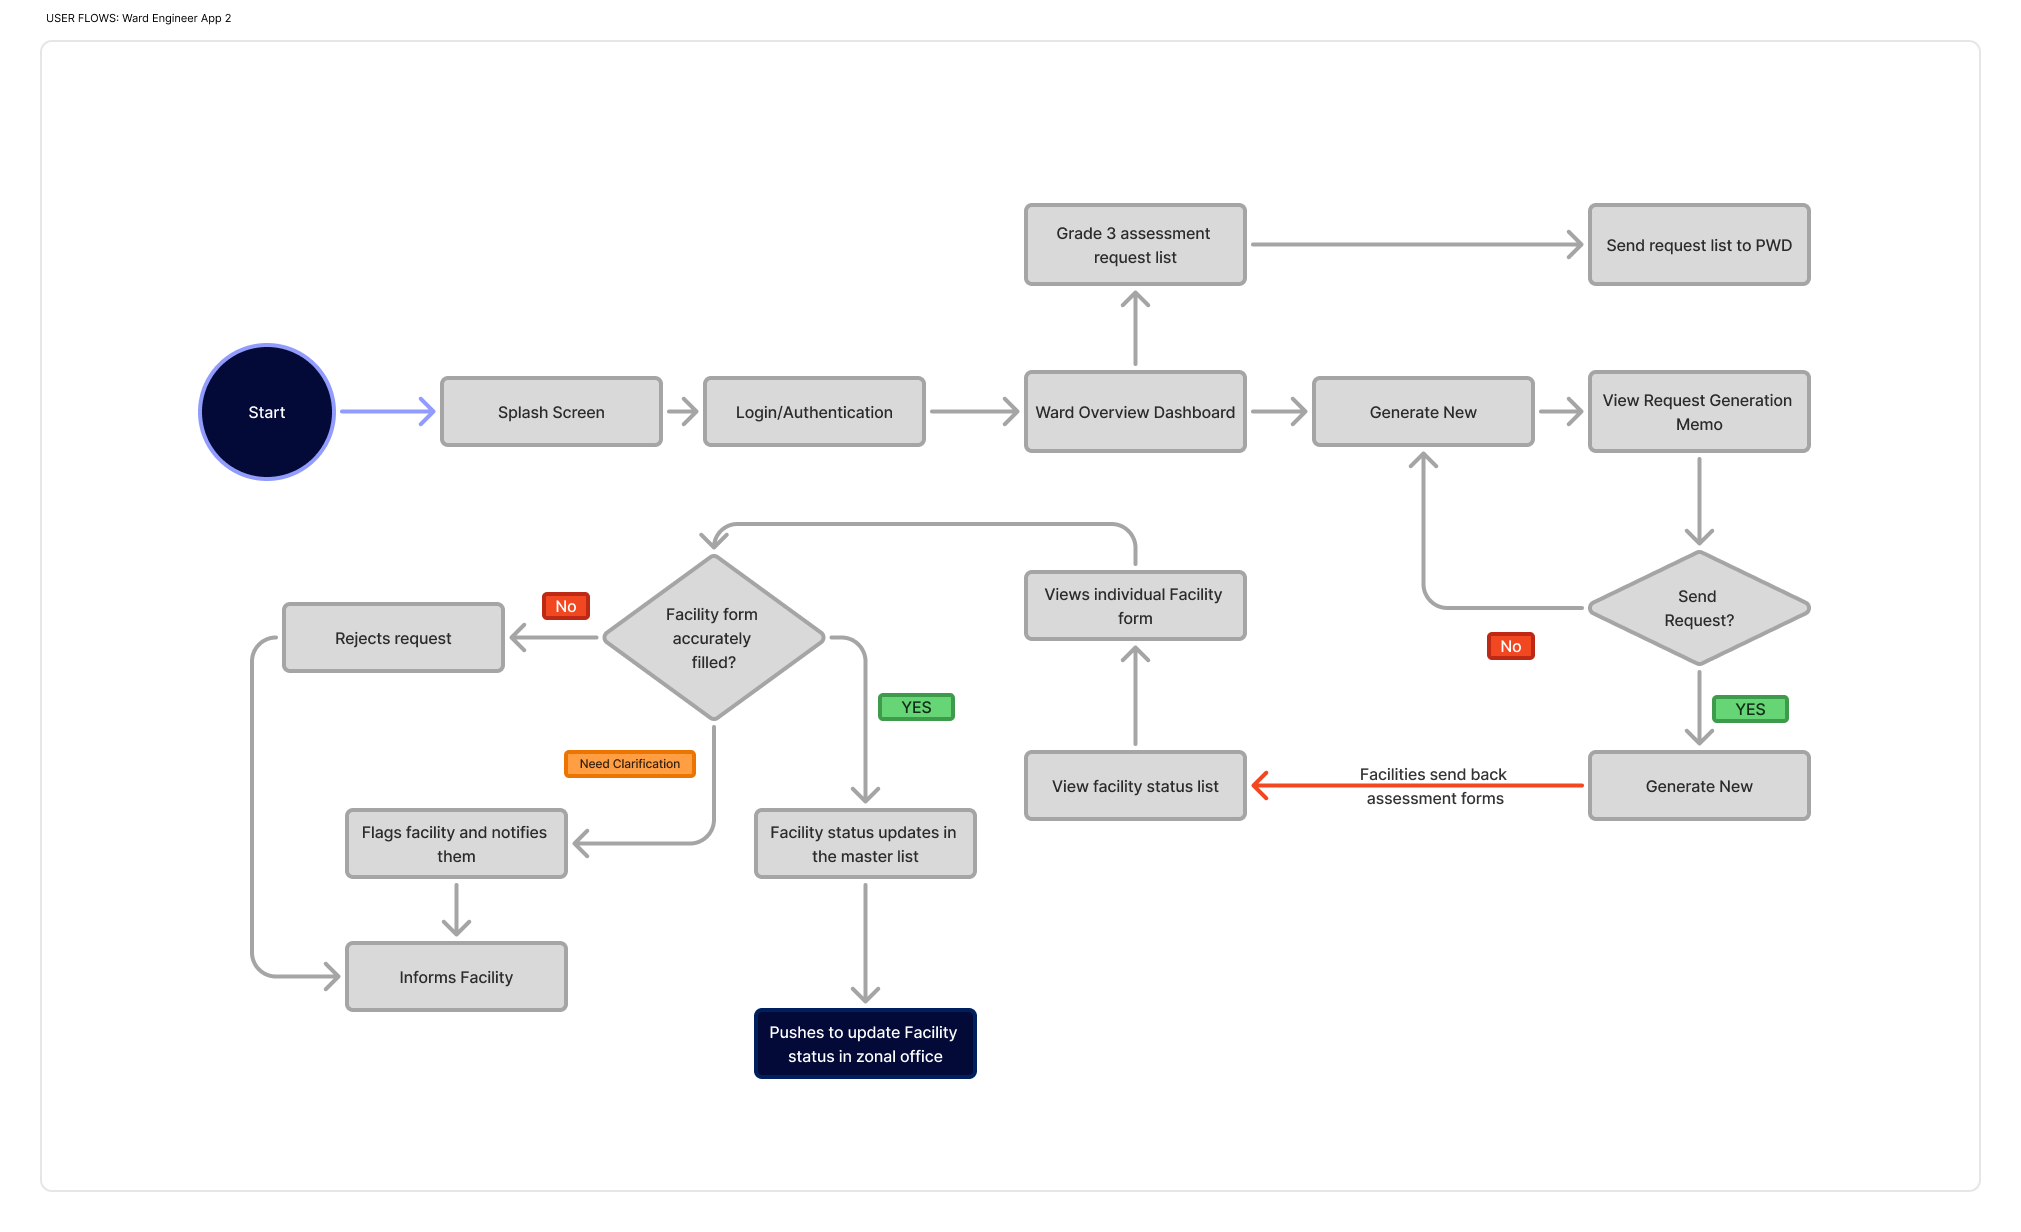
User flows
IA
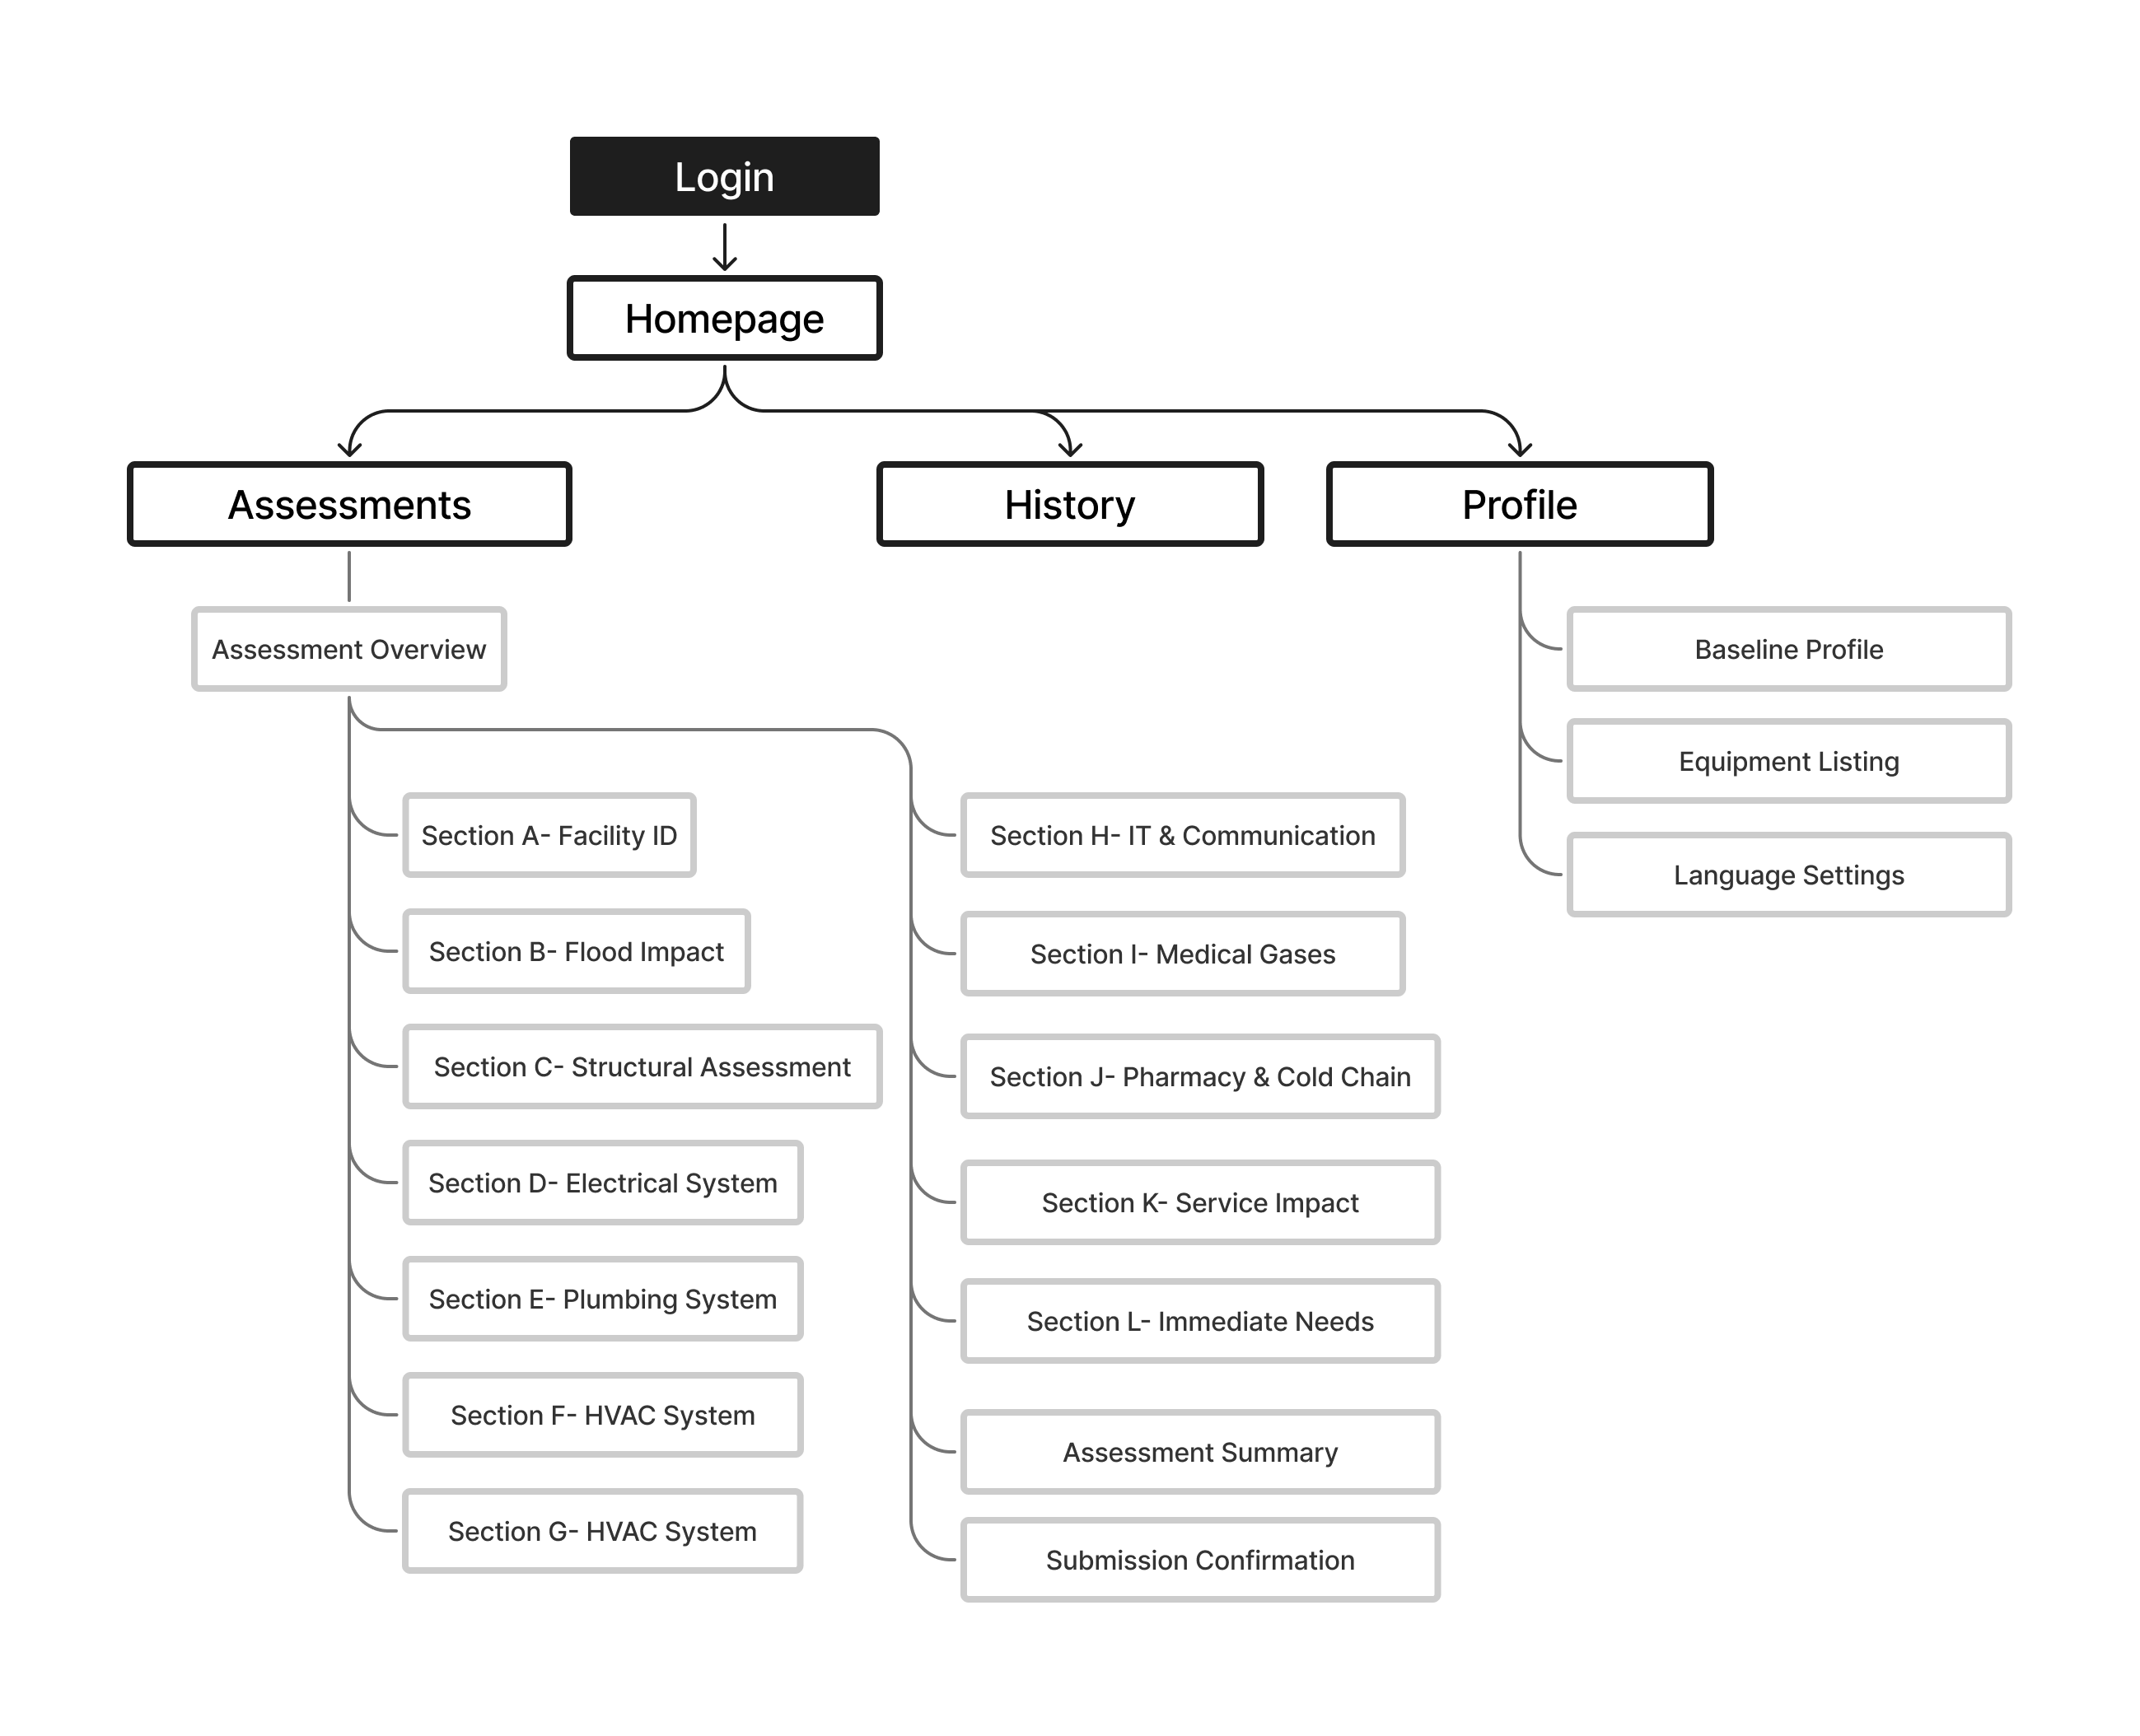
Key screens
Apda Mitra Command App
Apda Mitra Field App
Prototype
Proxy stakeholder co-designing
The iterative workshop process focused on identifying friction points and validating the service framework:
Participants were assigned stakeholder roles and briefed on their specific statutory responsibilities.
Participants were asked to think aloud while navigating the Field and Command apps in crisis scenarios.
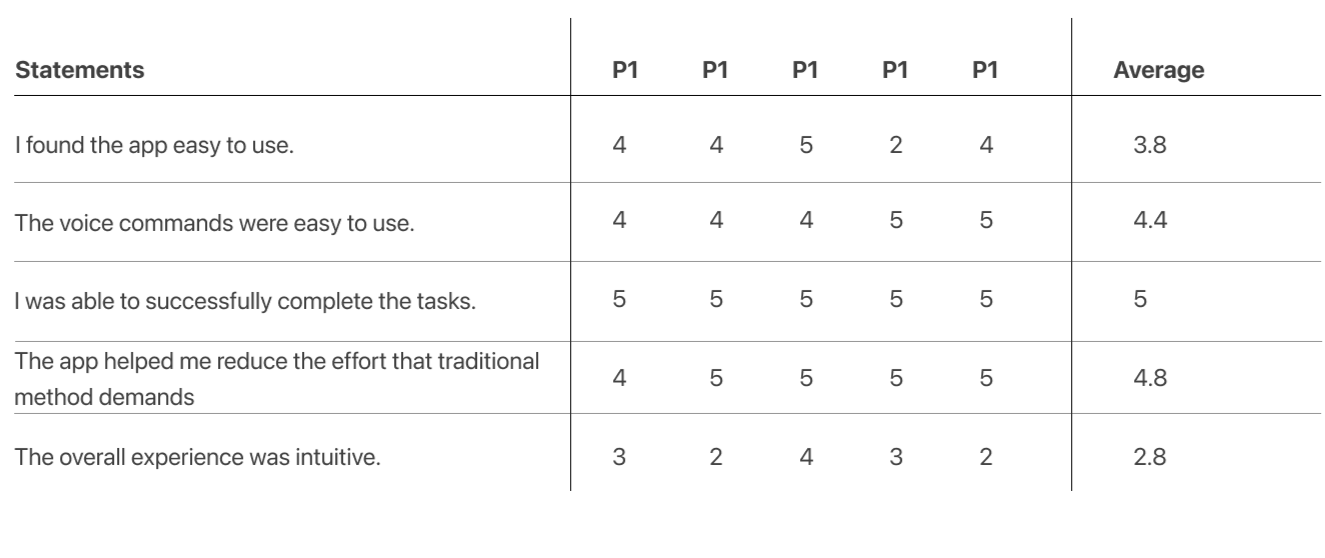
Conducted a 5-point Likert survey to quantify usability, confidence, and perceived transparency.
Observed that complete co-design could not be fully successful due to a lack of specialized disaster expertise among proxies.
Conclusion
The RBAC two-front glass box service framework is a new approach in risk management that can help bridge the data and communication gaps between siloed stakeholders.
Future Directions
- Testing Confidence Scoring with real flood data and verified assessment scores.
- Expanding the framework to other government infrastructures under BMC, such as public schools, railways, and arterial road networks.
Market Opportunities
The digital service can be extended directly to other infrastructural risk assessment and budget estimation scenarios during disaster management.
The indirect opportunity lies in corporate risk management as well as adapting the framework for various non-disaster government departments that require transparent, multi-layer approval chains.